
Monitoring infrastructure
Overview
Monitoring is what keeps a Rayls infrastructure healthy, performant and secure. This section gives a high-level view of how to monitor the key components in both the Private Network and Rayls Sovereign infrastructures using well-established third-party tools, which between them provide real-time monitoring, alerting and visualisation of critical metrics.
Reliable operation depends on catching problems early, and effective monitoring gives the insight into system health, performance trends and emerging issues that makes that possible.
Rayls components generate logs that are accessible through container outputs, and those logs can be extracted or exported to other analysis and alerting solutions.
For installation and configuration detail, refer to the official documentation for each of the monitoring tools listed below.
Recommended Monitoring Tools
Rayls recommends the following third-party tools for monitoring the Rayls infrastructure:
- Prometheus: A widely used open-source tool for collecting real-time metrics and monitoring system performance. Read more in Prometheus Documentation.
- Grafana: A visualisation tool that integrates with Prometheus to display real-time dashboards and monitor key metrics. Read more in Grafana Documentation.
- MongoDB Monitoring: MongoDB provides its own monitoring features, which integrate with tools such as Prometheus and Grafana. Read more in MongoDB Monitoring Documentation.
- Centralised Logging: Solutions such as the ELK Stack or Fluentd (Elasticsearch, Logstash, and Kibana) can be used to centralise and manage logs from Rayls components.
Key Metrics to Monitor
The specific setup and configuration of monitoring tools depends on the environment, although the metrics below are a reasonable general starting point across both the Private Network and Rayls Sovereign infrastructures.
When monitoring the Private Network and Rayls Sovereign, track the key performance indicators for each component:
- For the Relayer, monitor CPU usage, transaction throughput, and error rates.
- The Private Network Hub (as Hyperledger Besu) requires tracking block production time and peer connectivity.
- For MongoDB, focus on query performance, disk space usage, and replica set health, and check backup integrity alongside them.
- For the Block Explorer, monitor API response times and data consistency.
Each component in a Rayls infrastructure can expose metrics compatible with these tools. Refer to the documentation for each monitoring tool to configure collection and visualisation of those metrics.
Dashboard and Visualization Examples
Grafana provides dashboards that can be tailored to display the relevant metrics from both the Private Network and Rayls Sovereign infrastructures.
- System Health Dashboard: Track CPU, memory, and disk usage across all Rayls components.
- Transaction Throughput Dashboard: Monitor the number of transactions processed by Relayers and other core components.
- Database Performance Dashboard: Show MongoDB performance metrics such as query time and replication health.
For templates and examples, refer to the official Grafana documentation or the dashboards available in the Grafana community. Read more in Grafana Dashboards.
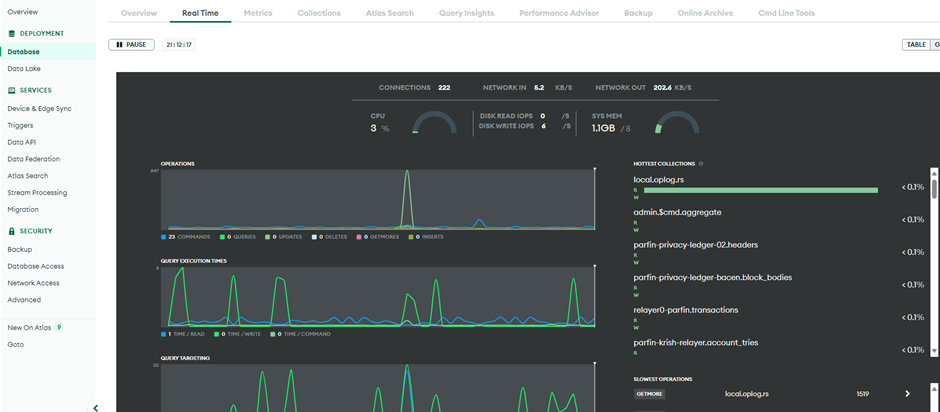
Examples of Grafana dashboard: Besu Full | Grafana Labs
Rayls Sovereign ledger Monitoring Example
The Rayls Sovereign ledger container exposes Prometheus-formatted metrics data, which can be obtained from the /debug/metrics/prometheus endpoint of the container.
Grafana Dashboard
A Grafana dashboard for the metrics from the Rayls Sovereign ledger container is included in the misc folder, and it can be imported into a Grafana instance directly.
Here is a sample of what the dashboard looks like:
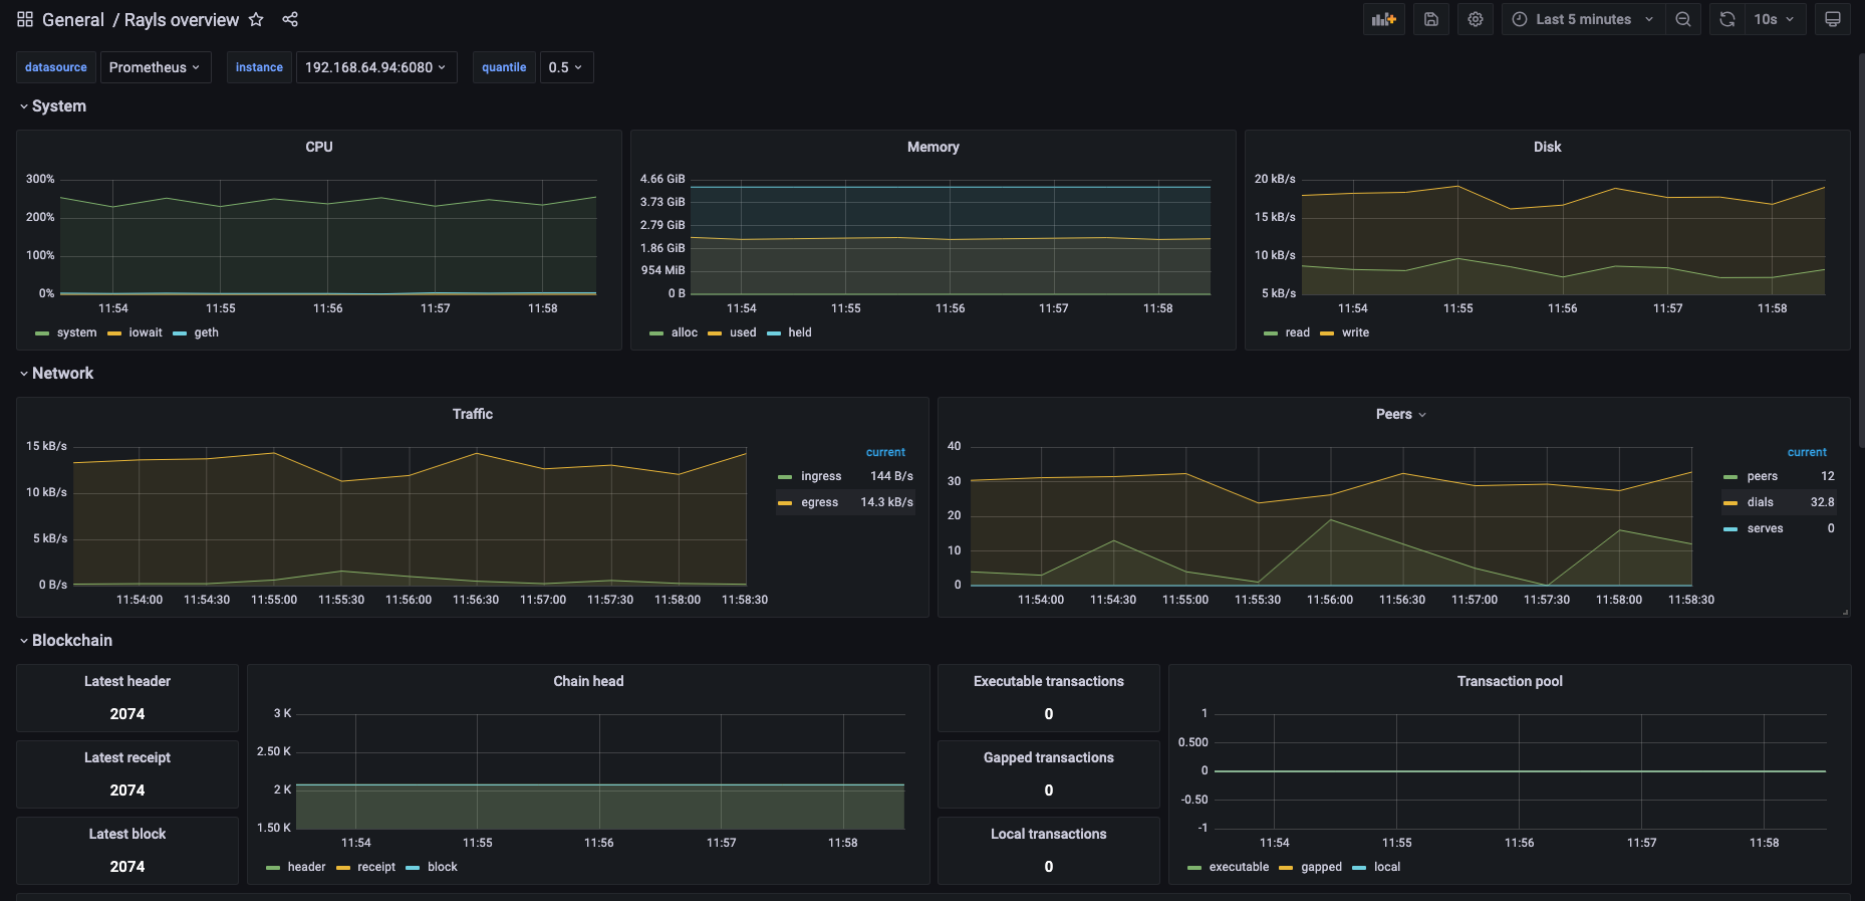
Note that the actual service names for Prometheus and Grafana may vary depending on how they were installed in the cluster.
Prometheus operator and Service Monitor
The Prometheus Operator manages Prometheus instances in a Kubernetes cluster, along with other monitoring components such as Alertmanager and ServiceMonitor.
Service monitoring can be enabled in the Helm chart, which allows the Prometheus Operator to scrape metrics from the Rayls Sovereign ledger automatically. To enable it, set serviceMonitor.enabled to true in the values.yaml file when installing the Helm chart.
Updated 6 days ago